Portfolio Overview
Research-driven map connecting EdS Technology in Schools competencies to real-time data design and advising systems.
Research-driven map connecting EdS Technology in Schools competencies to real-time data design and advising systems.
Download the full CV showcasing leadership, counseling, and instructional design accomplishments across the ISLT program.
Overview of EdS coursework with term-by-term reflections tying graduate learning to applied practice.
Context, significant learnings, and ISTE growth narrative connecting accessibility, rapid prototyping, and ethical analytics.
Learning Technologies program goals paired with detailed reflections and artifacts demonstrating each outcome.

Interactive simulation showcasing dynamic Python visualizations and educational programming experiences.
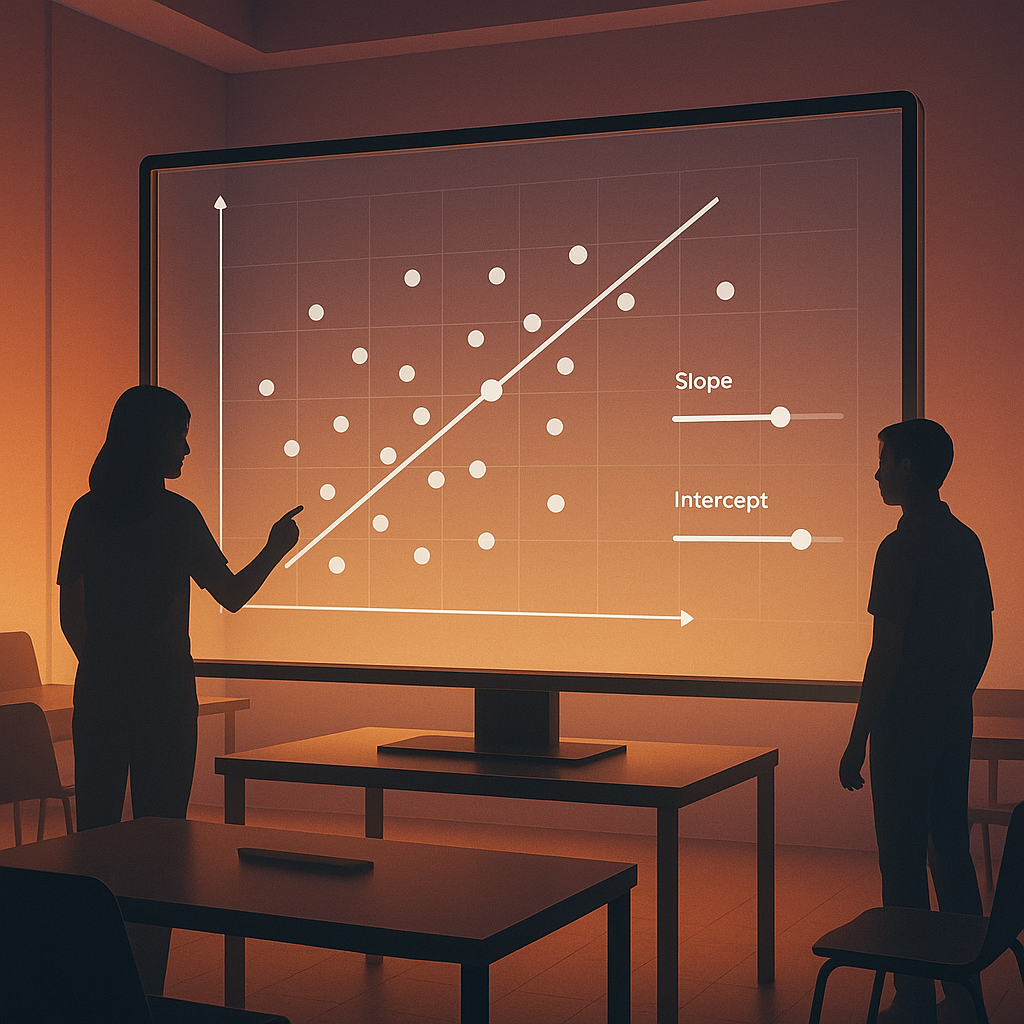
Hands-on regression tool allowing learners to adjust slope and intercept to explore statistical models in real time.
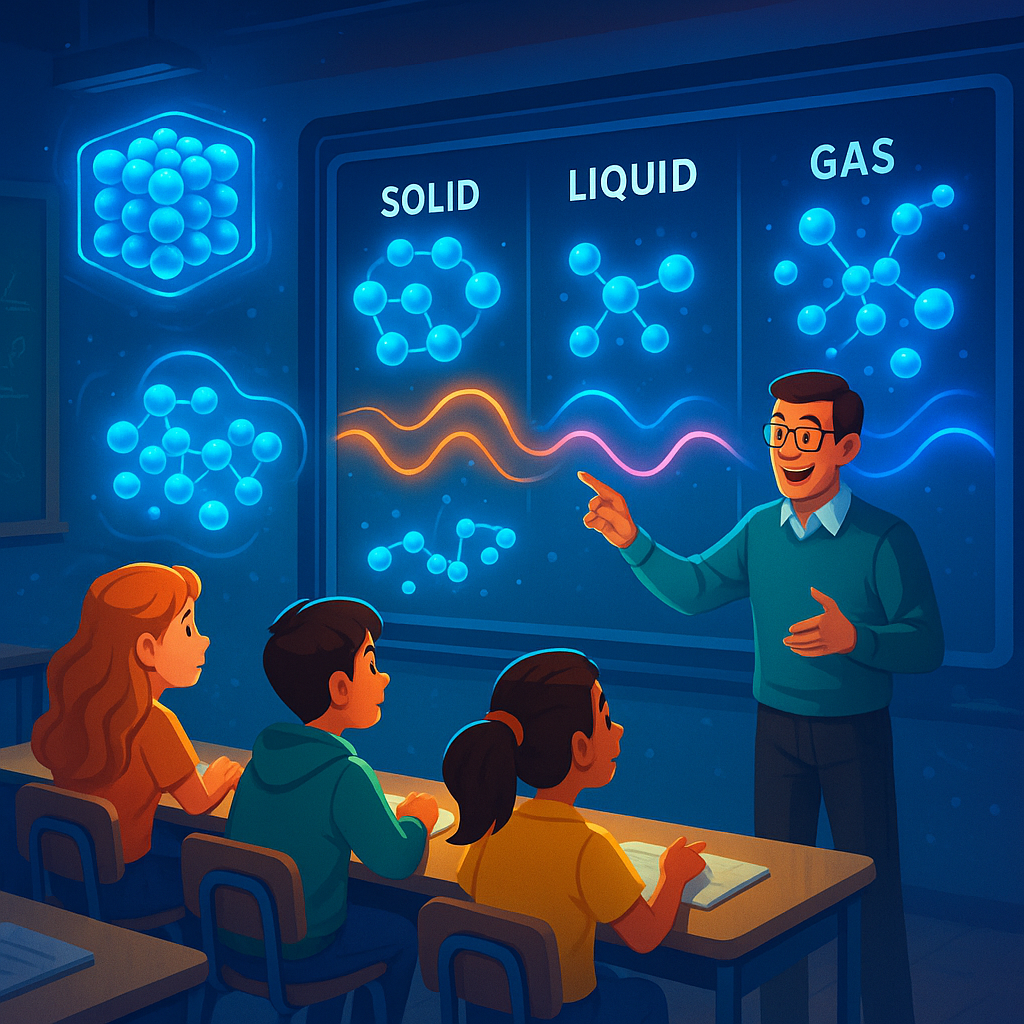
Animated explainer illustrating particle behavior across solid, liquid, and gas states for science learners.
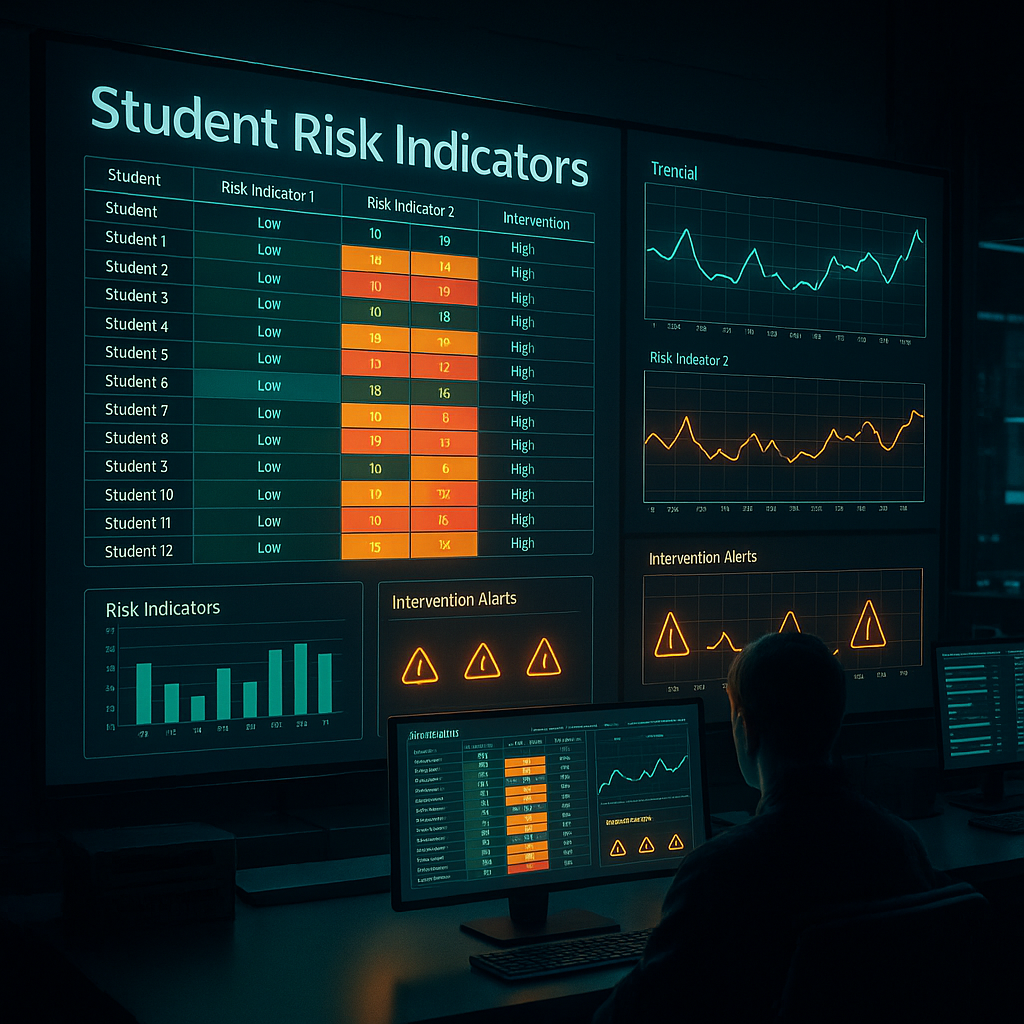
Microsoft Excel dashboard highlighting at-risk indicators with actionable insights for student success teams.
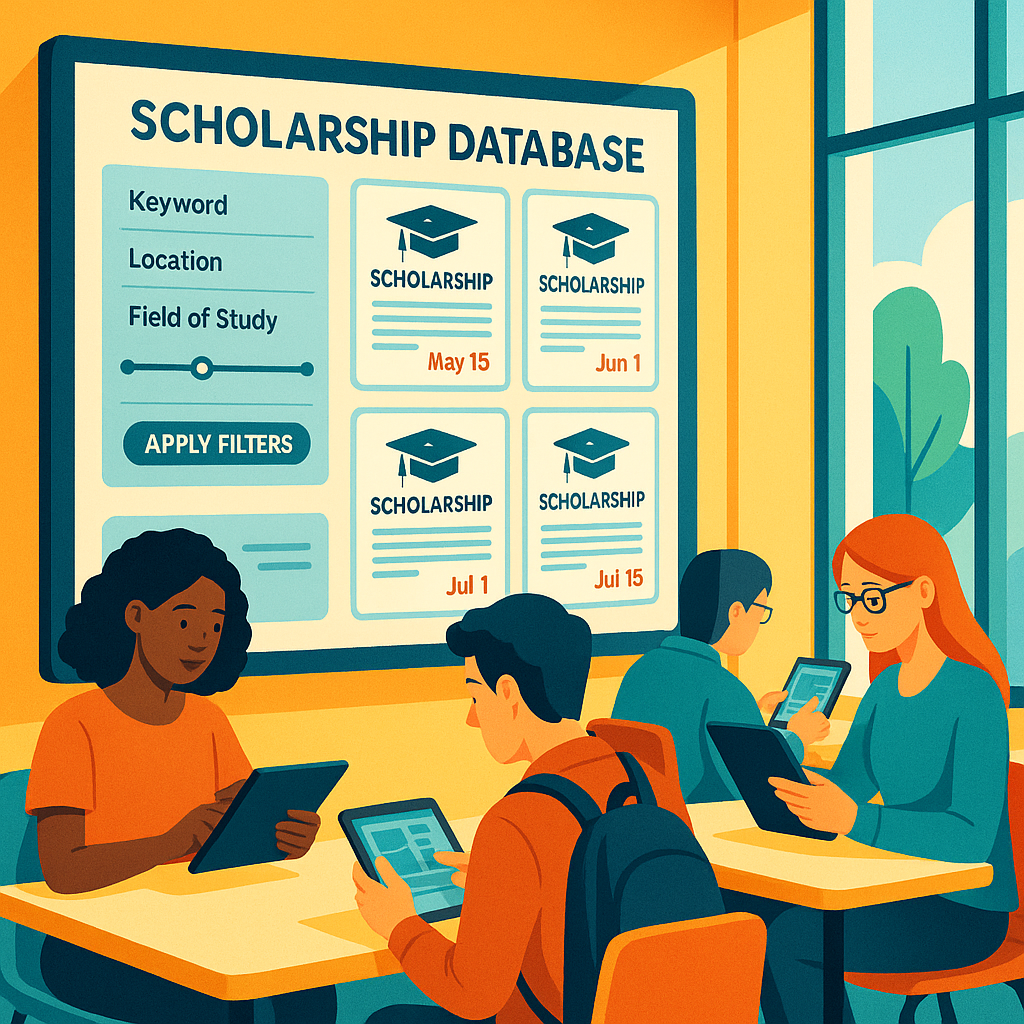
Searchable collection of scholarships with filters for eligibility, award type, and application deadlines.
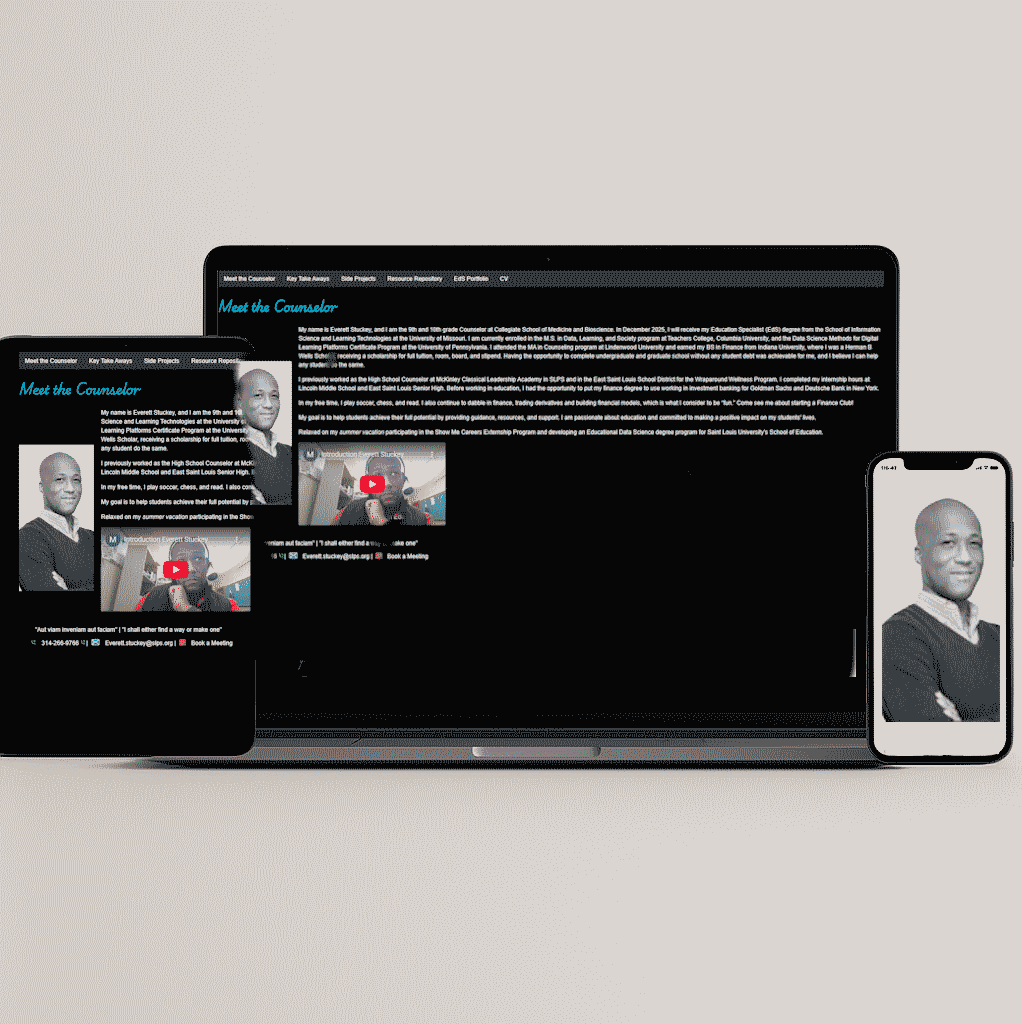
Personal professional website introducing portfolio highlights, instructional design philosophy, and contact info.
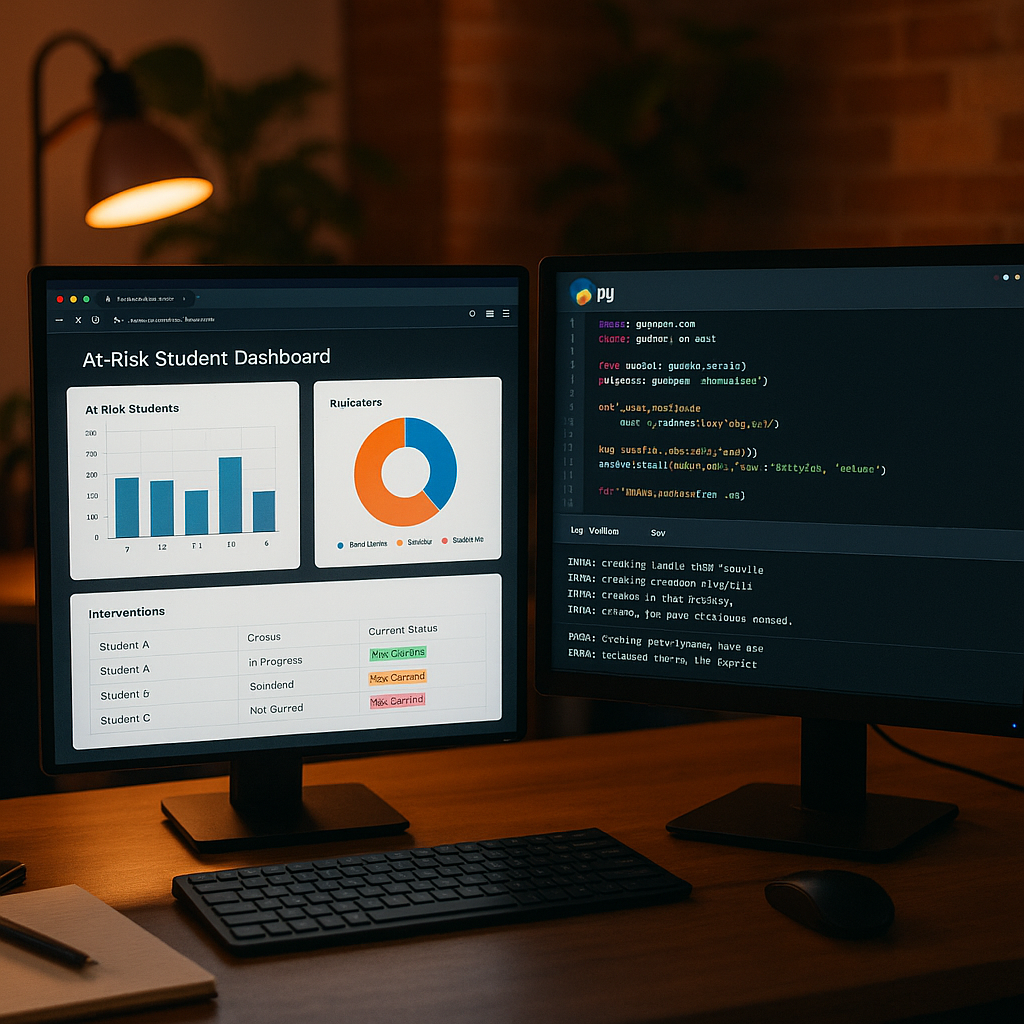
Integrated Python and HTML dashboard providing real-time monitoring for student risk indicators and interventions.
HTML blueprint outlining the Python automation workflow, data sources, and maintenance procedures supporting the at-risk dashboard.

Public overview of the confidential at-risk student dashboard with secure access instructions for district staff.

Multimedia eLearning module guiding learners through key financial market concepts with interactive media.

Digital literacy curriculum module covering safe and effective technology practices for students.
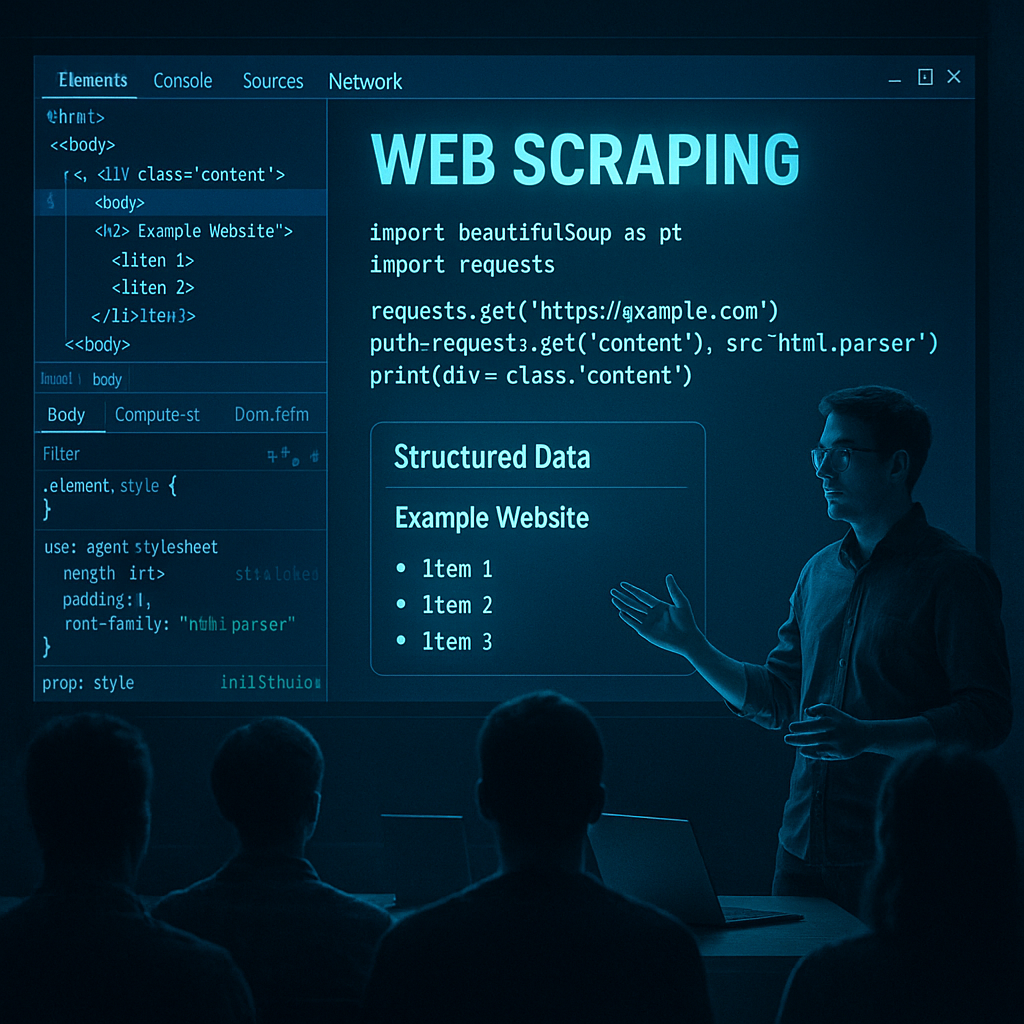
Video tutorial demonstrating Python techniques for scraping, cleaning, and analyzing web data.
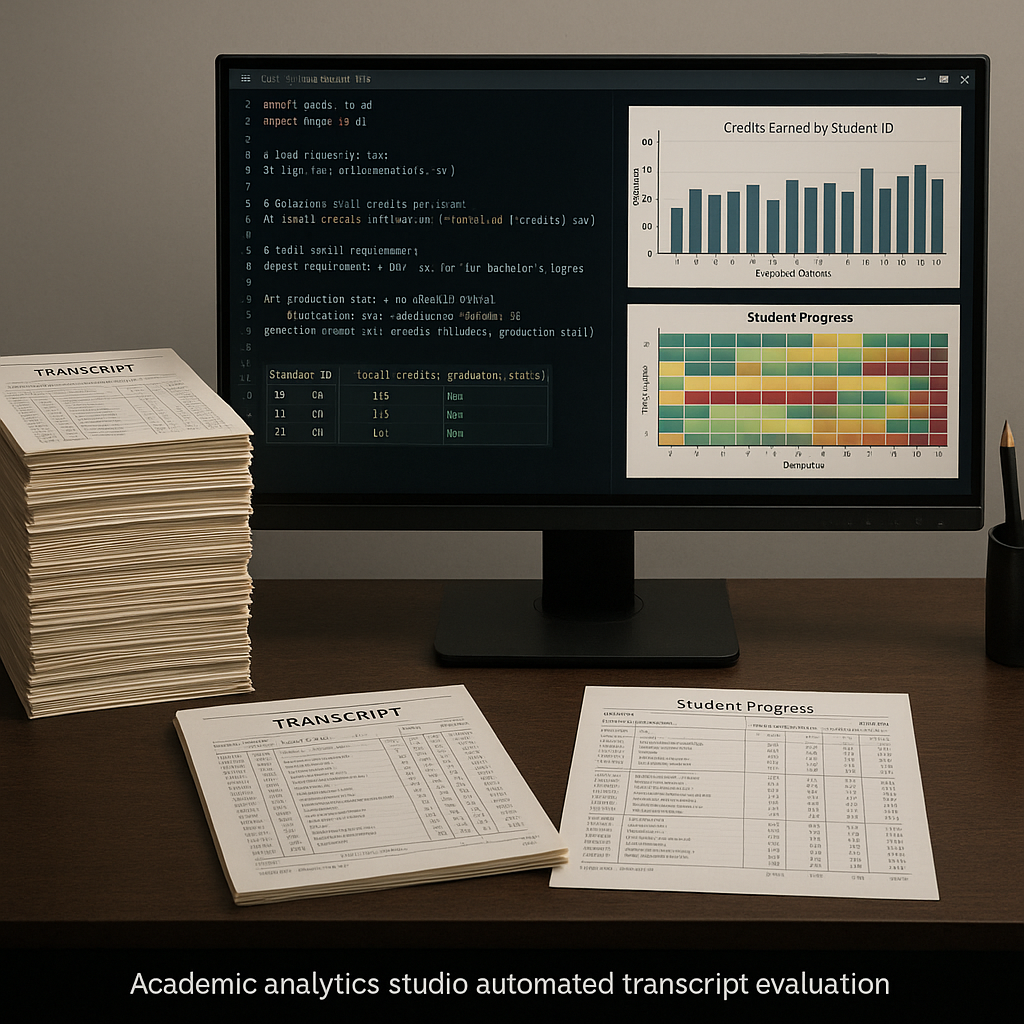
Python Colab notebook automating transcript evaluation workflows with data validation checks.
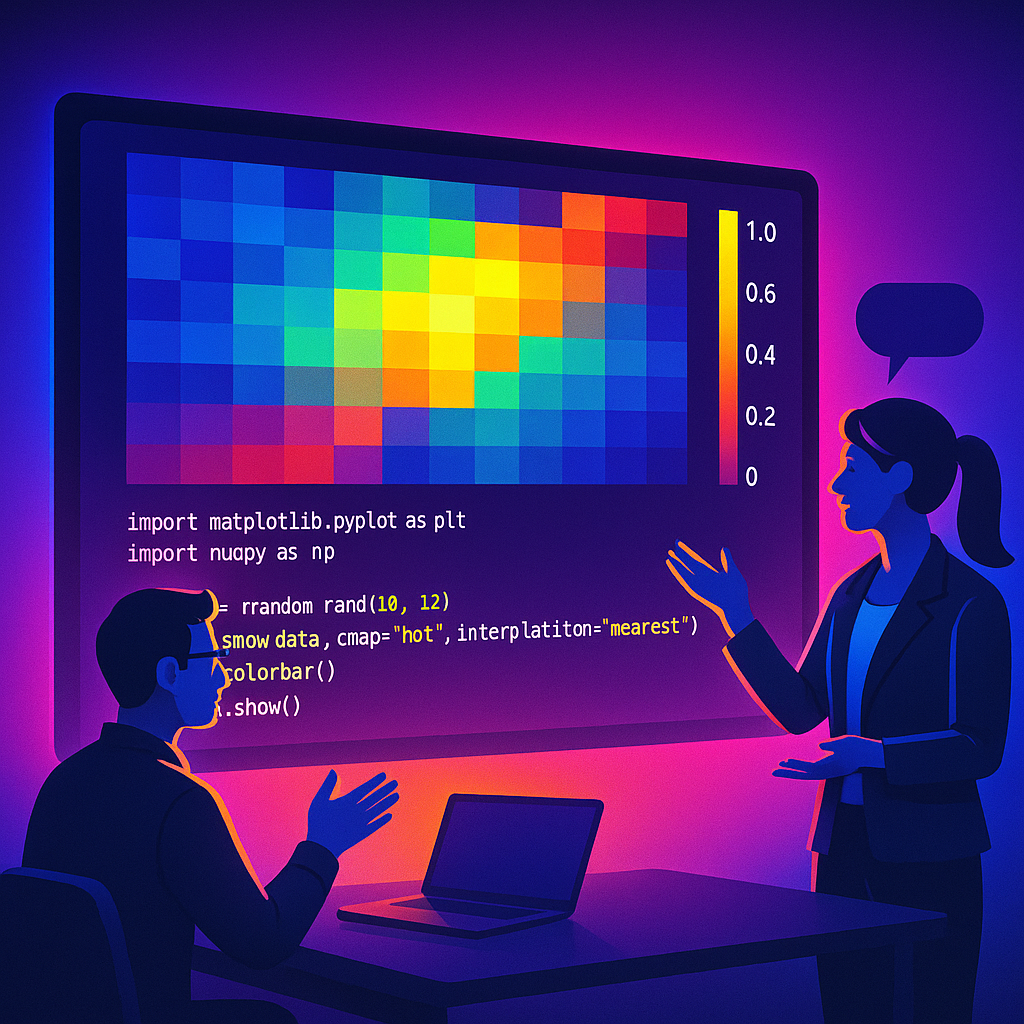
Colab notebook generating heatmap visualizations to reveal patterns in complex datasets.
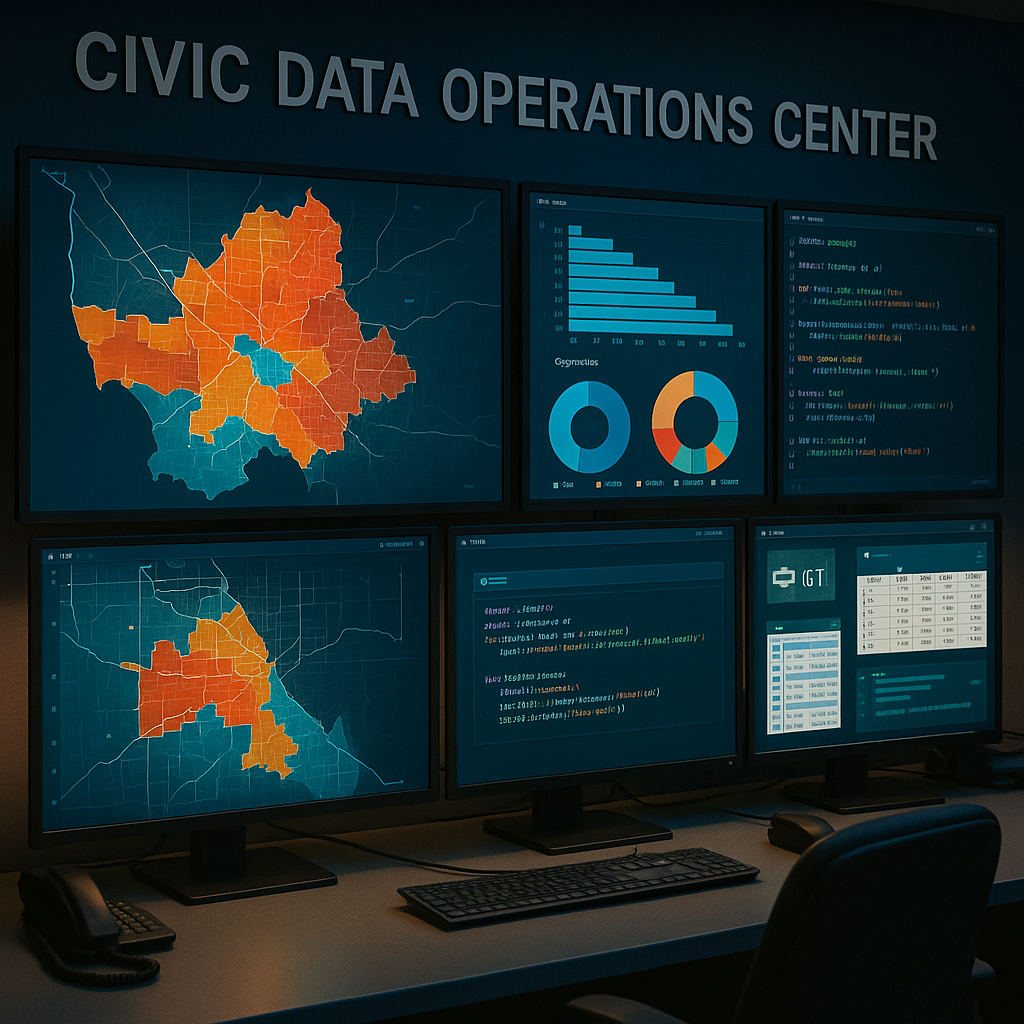
Automated pipeline retrieving demographic census data for analysis and reporting.

Interactive geographic visualization mapping student participants in career readiness and technology challenge programs.
Comprehensive data pipeline architecture integrating student applications, employer tracking, and site placement workflows through Microsoft Teams and Excel.
Low-code tools and rapid prototyping for instructional products.
This course reframed my development process from "complete the product, then gather feedback" to "ship a slice, learn, and iterate." I adopted a build-measure-learn loop that emphasized quick cycles and concrete evidence.
This course reframed my development process from "complete the product, then gather feedback" to "ship a slice, learn, and iterate." I adopted a build-measure-learn loop that emphasized quick cycles and concrete evidence. Rather than polishing a full module, I shared small increments - an intro video, a single practice task, a draft visual - and asked students to interact with them. Their responses immediately revealed what resonated and what needed revision, allowing me to redirect effort to the highest-impact changes.
Low-code tools accelerated this cadence. Templates, visual editors, and simple data integrations let me prototype without getting bogged down in implementation details. I storyboarded sequences, produced lightweight media, and assembled resources into coherent flows that students could try within a single class period. Because the artifacts were quick to build, they were also quick to change. When analytics and reflections showed that a prompt was unclear or a graphic was distracting, I revised the asset within hours, not days.
Evidence gathering was intentionally lightweight and ethical. I favored aggregate indicators - task completion rates, time-on-task, quick pulse checks - over invasive tracking. I paired these with short, structured reflections: one or two questions that helped me understand confusion points and cognitive load without overburdening students. This combination gave me direction while respecting privacy and class time. Over multiple iterations, completion improved and questions shifted from "What do I do?" to "Why does this pattern appear?" - a sign that the scaffolds were doing their job.
One representative example is the Financial Markets Slideshow . Early drafts tried to cover too much content per slide, leading to cognitive overload. Student feedback prompted me to reduce text density, pace narration, and use consistent visual metaphors. I aligned each segment with a single learning objective and added brief checks for understanding to surface misconceptions in real time. The result was higher engagement and clearer discussions about cause and effect in market behavior.
Another thread involved collaborative analysis using Python and Google Sheets. Students selected variables, co-constructed datasets, and iterated on visualizations as claims evolved. My role shifted from content deliverer to facilitator of inquiry: I provided exemplars, templates, and nudges, while learners explored multiple pathways to a solution. Rapid iteration - both in the artifacts and in the procedures - helped sustain momentum and made successes visible to the group.
Just as important were the pivots. Not every idea worked. Some interactive elements distracted more than they helped; a few templates were too rigid for diverse contexts. Because I was working in small slices, it was easy to remove, replace, or simplify without derailing progress. Those moments reinforced a key lesson: iteration is not a sign of failure but a mechanism for learning for both teacher and students.
Across the portfolio, rapid development practices reduced time to value and increased alignment between design intent and learner experience. Students spent more time wrestling with ideas and less time deciphering instructions. For me, the process provided a repeatable, humane way to improve materials: small bets, honest evidence, and steady refinement. See the Rapid Development Tools Portfolio for additional examples and iteration notes that document this approach in practice.
As I reflect on the impact of this course, I realize that it has fundamentally changed the way I approach instructional design. I no longer see myself as a content expert, but rather as a facilitator of learning. I understand that my role is not to create perfect materials, but to create materials that are good enough to spark meaningful learning. I have learned to trust the process of iteration and to see it as a natural part of the design cycle.
This shift in mindset has had a profound impact on my practice. I am more willing to take risks and try new things, knowing that I can always iterate and improve. I am more focused on creating materials that are accessible and inclusive, and I am more intentional about gathering feedback from students and using it to inform my design decisions.
One of the most significant takeaways from this course is the importance of empathy in instructional design. I have learned to see things from the student's perspective and to design materials that meet their needs. I have also learned to be more mindful of the emotional and social aspects of learning, and to create materials that are engaging and motivating.
Overall, this course has been a game-changer for me. It has helped me to develop a more nuanced understanding of instructional design and to see myself as a facilitator of learning. I am excited to continue to apply the principles and practices I have learned in this course to my future work.